Tremor
Tremor provides React components specifically designed for dashboards and data visualization. Charts, KPIs, and data tables—everything for building analytics interfaces.
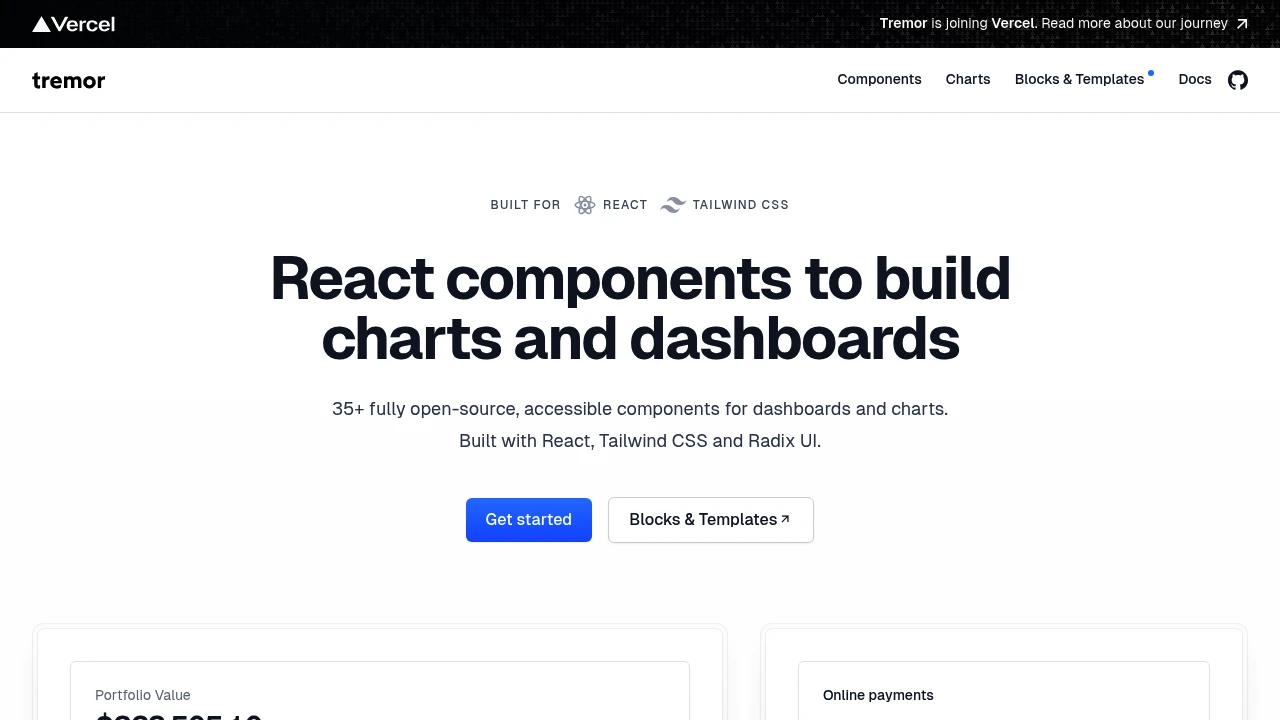
Tremor is purpose-built for dashboards and data visualization. Instead of adapting general UI components for analytics, Tremor provides charts, KPIs, and data displays designed specifically for this use case.
Key Features:
- Chart Components - Line, bar, area, donut, and more
- KPI Cards - Metrics display with trends
- Data Tables - Sortable, filterable data grids
- Tailwind Based - Customizable with utilities
Why Tremor for dashboards:
- Purpose Built - Designed for data visualization
- Consistent Design - Cohesive dashboard aesthetic
- Responsive - Charts that work on all screens
- Easy Integration - Simple React components
Tremor components:
- Charts - Line, bar, area, scatter, donut
- Metrics - Numbers, trends, sparklines
- Tables - Rich data tables
- Inputs - Date pickers, search, filters
Tremor is the obvious choice when building internal tools, admin panels, or any data-heavy interface. The focused component set means less decision-making and more consistent results.
Categories:
Ad


 Emergent